🎬 Hollywood
The End of Oak Street
NOW SHOWING
D1–D49 · WW $121.49M · Updated Oct 3, 2026
$54.44M
—
day-on-day
$121.49M
Worldwide Gross
$21.05M
Opening Weekend
$29.01M
Week 1 Domestic
$90M
Budget (Est.)
DISASTER
Sponsored
📈 Collection trend · US Domestic
| Day | Date | US Domestic ($M) | Δ Day | Note |
|---|---|---|---|---|
Week 1 Aug 14 – 20 | 29.01 | D1–D7 | ||
| Day 1 (Fri) | Aug 14 | 8.05 | — | Fri · $2,336/theater · 3,446 theaters |
| Day 2 (Sat) | Aug 15 | 7.42 | ▼ -8% | Sat · $2,153/theater · 3,446 theaters |
| Day 3 (Sun) | Aug 16 | 5.58 | ▼ -25% | Sun · $1,619/theater · 3,446 theaters |
| Day 4 (Mon) | Aug 17 | 1.96 | ▼ -65% | Mon · $568/theater · 3,446 theaters |
| Day 5 (Tue) | Aug 18 | 2.98 | ▲ +52% | Tue · $865/theater · 3,446 theaters |
| Day 6 (Wed) | Aug 19 | 1.73 | ▼ -42% | Wed · $501/theater · 3,446 theaters |
| Day 7 (Thu) | Aug 20 | 1.29 | ▼ -25% | Thu · $374/theater · 3,446 theaters |
Week 2 Aug 21 – 27 | 12.46 | D8–D14 | ||
| Day 8 (Fri) | Aug 21 | 2.42 | ▲ +88% | Fri · $696/theater · 3,478 theaters |
| Day 9 (Sat) | Aug 22 | 3.81 | ▲ +58% | Sat · $1,097/theater · 3,478 theaters |
| Day 10 (Sun) | Aug 23 | 2.86 | ▼ -25% | Sun · $822/theater · 3,478 theaters |
| Day 11 (Mon) | Aug 24 | 0.77 | ▼ -73% | Mon · $221/theater · 3,478 theaters |
| Day 12 (Tue) | Aug 25 | 1.22 | ▲ +58% | Tue · $350/theater · 3,478 theaters |
| Day 13 (Wed) | Aug 26 | 0.77 | ▼ -37% | Wed · $220/theater · 3,478 theaters |
| Day 14 (Thu) | Aug 27 | 0.61 | ▼ -20% | Thu · $176/theater · 3,478 theaters |
Week 3 Aug 28 – Sep 3 | 6.69 | D15–D21 | ||
| Day 15 (Fri) | Aug 28 | 1.25 | ▲ +104% | Fri · $428/theater · 2,923 theaters |
| Day 16 (Sat) | Aug 29 | 2.17 | ▲ +74% | Sat · $744/theater · 2,923 theaters |
| Day 17 (Sun) | Aug 30 | 1.52 | ▼ -30% | Sun · $522/theater · 2,923 theaters |
| Day 18 (Mon) | Aug 31 | 0.40 | ▼ -74% | Mon · $136/theater · 2,923 theaters |
| Day 19 (Tue) | Sep 1 | 0.62 | ▲ +57% | Tue · $214/theater · 2,923 theaters |
| Day 20 (Wed) | Sep 2 | 0.40 | ▼ -36% | Wed · $137/theater · 2,923 theaters |
| Day 21 (Thu) | Sep 3 | 0.32 | ▼ -21% | Thu · $108/theater · 2,923 theaters |
Week 4 Sep 4 – 10 | 4.39 | D22–D28 | ||
| Day 22 (Fri) | Sep 4 | 0.67 | ▲ +112% | Fri · $304/theater · 2,202 theaters |
| Day 23 (Sat) | Sep 5 | 1.18 | ▲ +76% | Sat · $536/theater · 2,202 theaters |
| Day 24 (Sun) | Sep 6 | 1.06 | ▼ -10% | Sun · $481/theater · 2,202 theaters |
| Day 25 (Mon) | Sep 7 | 0.89 | ▼ -17% | Mon · $402/theater · 2,202 theaters |
| Day 26 (Tue) | Sep 8 | 0.30 | ▼ -66% | Tue · $136/theater · 2,202 theaters |
| Day 27 (Wed) | Sep 9 | 0.19 | ▼ -38% | Wed · $84/theater · 2,202 theaters |
| Day 28 (Thu) | Sep 10 | 0.10 | ▼ -43% | Thu · $48/theater · 2,202 theaters |
Week 5 Sep 11 – 17 | 1.43 | D29–D35 | ||
| Day 29 (Fri) | Sep 11 | 0.30 | ▲ +186% | Fri · $239/theater · 1,253 theaters |
| Day 30 (Sat) | Sep 12 | 0.50 | ▲ +67% | Sat · $399/theater · 1,253 theaters |
| Day 31 (Sun) | Sep 13 | 0.33 | ▼ -35% | Sun · $259/theater · 1,253 theaters |
| Day 32 (Mon) | Sep 14 | 0.07 | ▼ -78% | Mon · $58/theater · 1,253 theaters |
| Day 33 (Tue) | Sep 15 | 0.11 | ▲ +59% | Tue · $91/theater · 1,253 theaters |
| Day 34 (Wed) | Sep 16 | 0.08 | ▼ -30% | #- · 1253 theaters |
| Day 35 (Thu) | Sep 17 | 0.04 | ▼ -46% | Thu · $34/theater · 1,253 theaters |
Week 6 Sep 18 – 24 | 0.39 | D36–D42 | ||
| Day 36 (Fri) | Sep 18 | 0.07 | ▲ +75% | Fri · $163/theater · 461 theaters |
| Day 37 (Sat) | Sep 19 | 0.14 | ▲ +93% | Sat · $315/theater · 461 theaters |
| Day 38 (Sun) | Sep 20 | 0.10 | ▼ -34% | Sun · $206/theater · 461 theaters |
| Day 39 (Mon) | Sep 21 | 0.02 | ▼ -79% | #- · 461 theaters |
| Day 40 (Tue) | Sep 22 | 0.03 | ▲ +50% | #- · 461 theaters |
| Day 41 (Wed) | Sep 23 | 0.02 | ▼ -33% | #- · 461 theaters |
| Day 42 (Thu) | Sep 24 | 0.01 | ▼ -50% | #- · 461 theaters |
Week 7 Sep 25 – Oct 1 | 0.07 | D43–D49 | ||
| Day 43 (Fri) | Sep 25 | 0.02 | ▲ +100% | #- · 103 theaters |
| Day 44 (Sat) | Sep 26 | 0.03 | ▲ +50% | #- · 103 theaters |
| Day 45 (Sun) | Sep 27 | 0.02 | ▼ -33% | #- · 103 theaters |
| Running Total (D1–D49) | 54.44 | US Domestic | ||
🇮🇳 The End of Oak Street India Box Office
| Market | Collection | Status |
|---|---|---|
| 🇮🇳 India Net | ₹5.74Cr | Running |
The End of Oak Street Hit or Flop Verdict
The End of Oak Street released on 2026-08-13. Collections will be updated daily as actuals are confirmed.
BUDGET
$90M
US DOMESTIC
$54.44M
VERDICT
DISASTER
📺
OTT Release
OTT release date not yet announced.
About The End of Oak Street
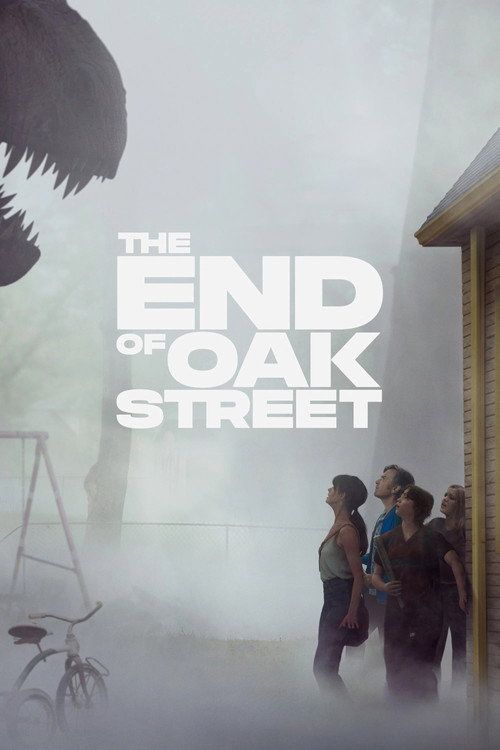
The End of Oak Street is a 2026 English film directed by David Robert Mitchell.
Sponsored
Film Details
| Director | David Robert Mitchell |
| Stars | Anne Hathaway, Ewan McGregor |
| Studio | Warner Bros. Pictures, Bad Robot |
| Language | English |
| Release | Aug 14, 2026 |
| Budget | $90M |
| US Domestic | $54.44M |
| India Net | ₹5.74Cr |
| WW Gross | $121.49M |
| Verdict | DISASTER |
Sacnic verdict scale
0.6x
recovery ratio* · $54.44M net / $90M budget
BLOCKBUSTER4.0x+
SUPERHIT2.5x+
HIT1.75x+
AVERAGE1.25x+
FLOP0.75x+
DISASTER<0.75x← 0.6x
* Based only on US domestic box office against the budget. International grosses and home-entertainment revenue are not counted.
Sponsored
Related Pages
US Box Office →
Sponsored